If you're running Zabbix, PRTG, Nagios, or some form of basic monitoring, you know it works.
It tells you when a server goes down. It shows you when a disk is getting full. It gives you a CPU usage graph over time.
And for a while, that's enough.
But there's a moment — and most MSPs and IT teams know it — when an alert comes in, you can see that "something failed," and you still have no idea what to do, on which specific device, or why it happened.
That's where basic monitoring runs out of runway. And that's where an RMM starts to matter.
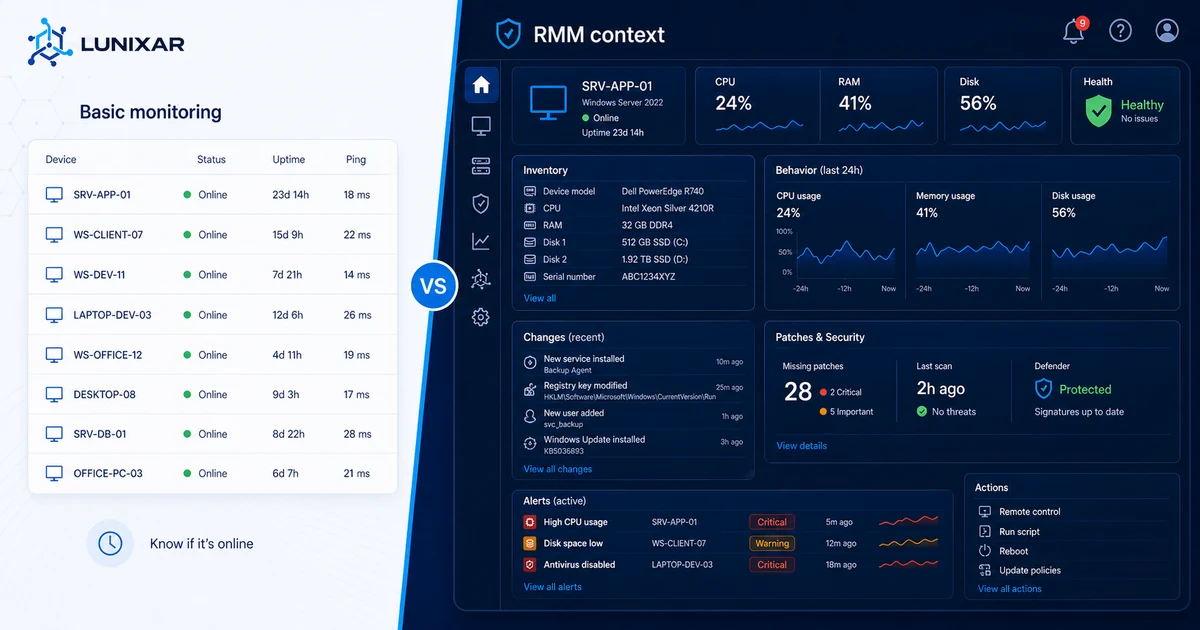
1) Basic monitoring tells you something happened. An RMM tells you what, why, and on which device.
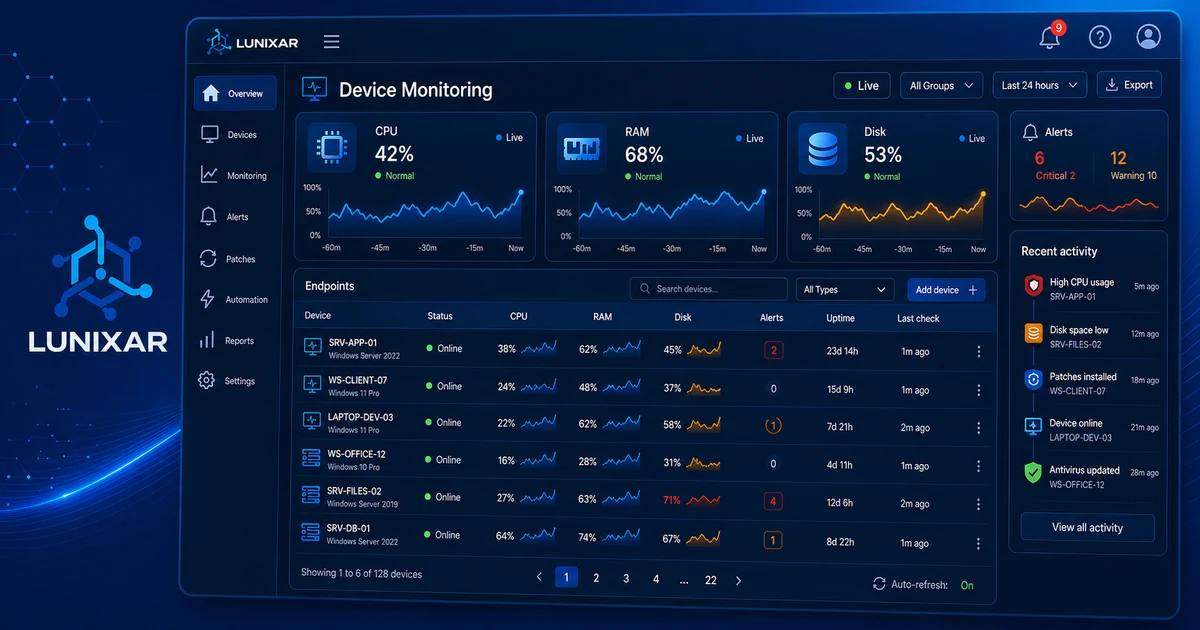
Basic monitoring does one thing well: it notifies you when something crosses a threshold.
CPU at 95% → alert. Disk at 90% → alert. Host not responding → alert.
But the alert is just the starting point. What comes next — diagnosing the issue, understanding the context, deciding what to do — is outside the tool. You have to connect, dig through logs, check what's running, ask the user what happened.
With an RMM, that context is already there when the alert fires: what software the device has installed, what changed in the last few days, how much free memory there was before the spike, whether there were any related system events.
Basic monitoring isn't wrong. It just gets you to a certain point and then leaves you on your own.
2) Basic monitoring doesn't know what's installed on the device
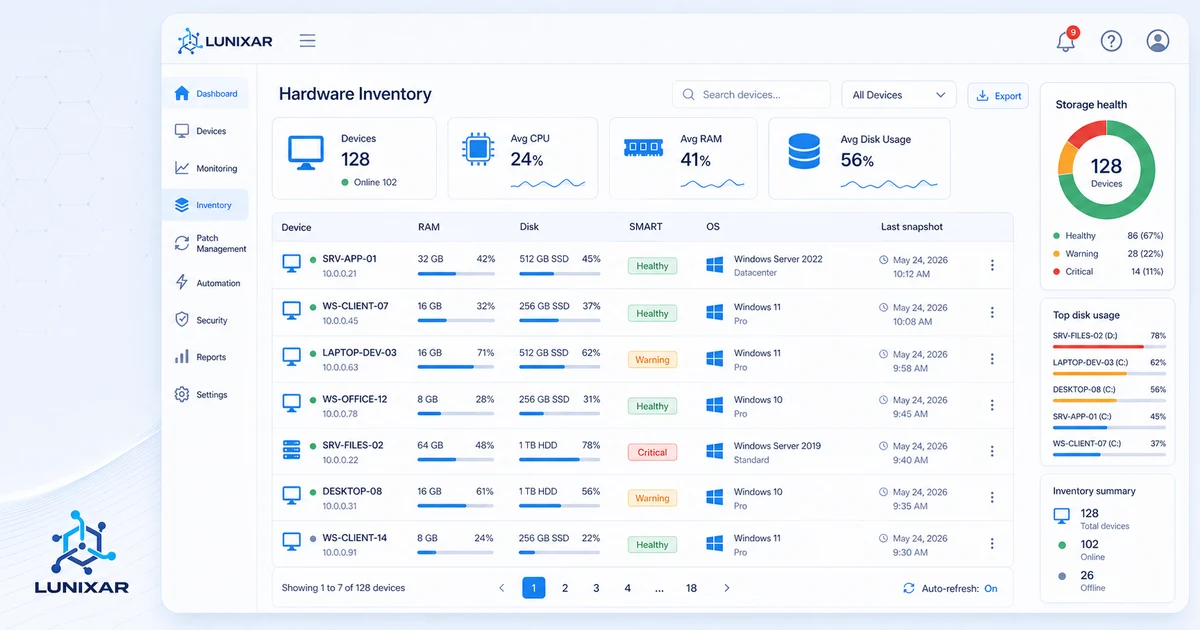
One of the most concrete differences: inventory.
Basic monitoring watches metrics. An RMM knows the device.
It knows what software is installed, at what version, what hardware it's running on, and what's changed in the past few days. When a CPU spike alert comes in, you don't have to connect and investigate what's causing it — the context is already there.
And when a user reports that "something changed" without knowing what, the snapshot history tells you in seconds.
That level of knowledge completely changes how you work: instead of investigating from scratch on every ticket, you're verifying hypotheses you already have before you even open a session.
3) From "it's down" to "I already fixed it"
Basic monitoring notifies you. An RMM lets you act.
That difference sounds simple, but it changes the entire operational flow.
With basic monitoring, the flow is: alert → open another tool → connect remotely → investigate → act. Multiple steps, multiple tools, time lost between each one.
With an RMM, the flow can be: alert → see the context → run the action → done. All from the same console.
Not because an RMM does magic — but because it brings visibility and the ability to act into the same place. That cuts the time between "I found out" and "I resolved it," which is exactly what separates proactive support from reactive support.
4) The proactivity basic monitoring can't give you
Basic monitoring is reactive by design. It waits for something to cross a threshold, then tells you.
A well-configured RMM goes one step earlier: it detects trends, not just point-in-time threshold crossings. A disk that's been growing abnormally for two weeks doesn't need to hit 95% for someone to notice. The behavior is already the signal.
Same with hardware: SMART attributes on a drive tell you if it's starting to degrade long before it fails. You only see that if you have a tool analyzing that data for you.
The difference between monitoring and proactive management is the difference between knowing your gas tank is empty and knowing you've been running low for three days.
5) When basic monitoring isn't enough anymore
Basic monitoring works well when:
- You have a small fleet and time to investigate each alert manually
- The failing device is easy to identify and access
- You don't need traceability or change history
- Reactive support is fine for now
It starts to fall short when:
- The fleet grows and you can't manually investigate every alert
- Tickets keep increasing but available time doesn't
- You want to move from reactive to proactive without doubling the team
- You need context before connecting so you don't waste time
It's not that one is categorically "better" than the other. It's that they serve different stages of an operation.
Closing
Basic monitoring is a solid starting point. The problem is staying there longer than you need to.
An RMM doesn't replace monitoring — it extends it with context, history, and inventory, and adds the ability to act without jumping between tools.
Lunixar RMM is built to make that transition feel natural: alerts that come with context, active per-device inventory, and actions you can run directly from the console — all in one platform.
2 weeks free to try it. No credit card required.
Related reading to keep going
If you want to turn this topic into a real operating workflow, continue with these guides: